Category: GPS (en)


(via tab « GPS / tableurs – spreadsheets »)

trajets réalisés comp

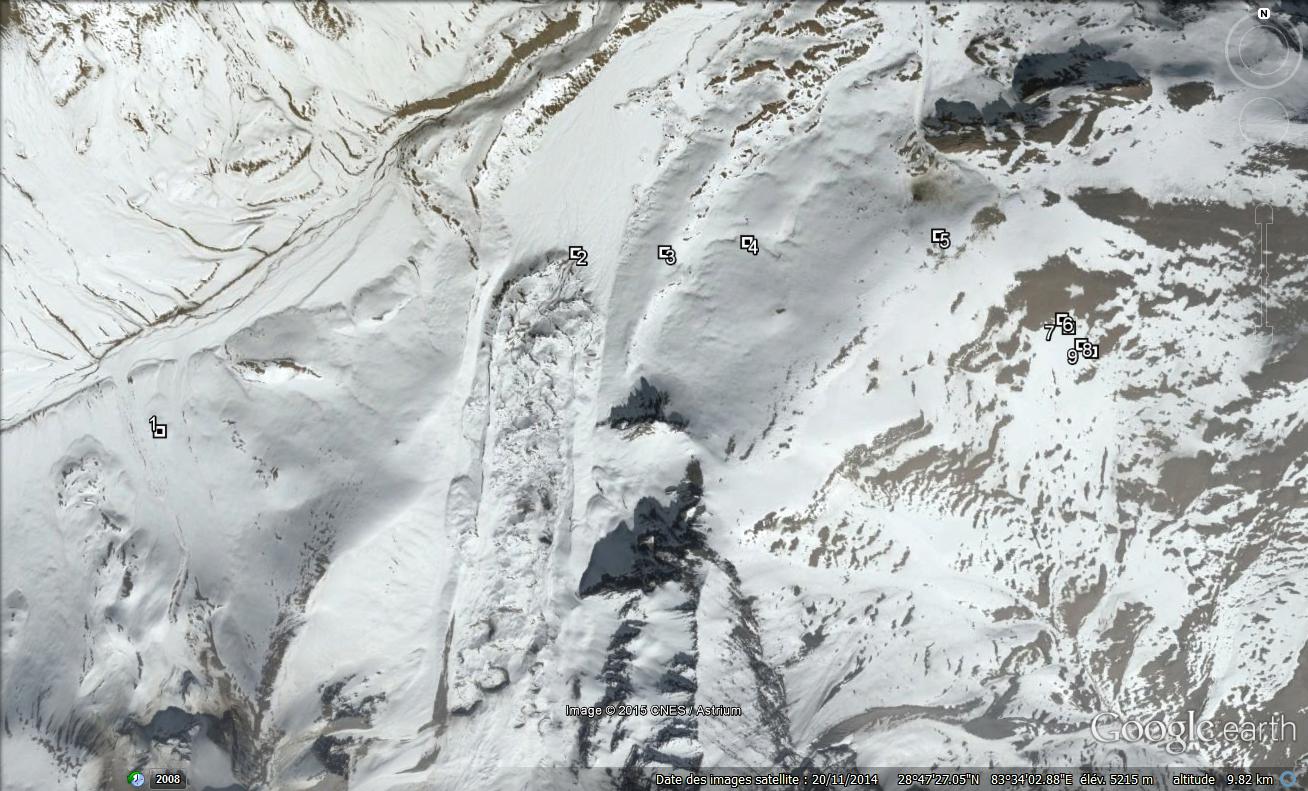
WayPoints are a posteriori placed on the track of the Google Earth satellite photo

Objectives:

1°) An Excel spreadsheet  has been created from the tracks recorded by the GPS during our treks. These spreadsheets will allow to visualize the stages, the ascents, the distances. They will allow, especially, to build a new project by modifying the stages.

2°) With the same spreadsheets, it will also be possible to send the points to Google Earth ( GE ) with the software GPSVisualizer, for changing a part of the track and generate a new treck on the same area.

Remark: The tracks recorded by the GPS are .kmz files. They are not downloadable on WordPress. It is not thus possible to give them directly but they can however be sent by email at the demand.

Modus Operandi:

1 °) to prepare a trek project from a realized route

The realized tracks have been transcribed in GE to a set of waypoints positioned on the tracks on which we traveled. The GPS has a precision of positioning of about ten meters and it is settled to record its position every 20m. It is thus necessary to take into account the resultant approximation during the use of these indicative datas.

All the points have been recorded in a GE file, exported and translated by GPSVisualizer from .kmz (datas GE) to .xlsx (datas Excel). At the end of this export, all the points for a given track, are recorded in a spreadsheet Excel allowing to show:

In Input :

  • The « GPS » worksheet with, for every GPS points: its name GE, its, if necessary, real name, its two coordinates and  its altitude, its distance tothe following point *, and the indication of a possible stage. The calculation gives slopes point by point and altitudes, ascents at the stage, and distance to the stages.

*The distances between points are rough and calculated on GE as the distance between points is not recorded by the GPS. It is thus necessary to make a statement by looking for the often frequent and acute bends in mountain. They are not always visible, particularly in forests. Approximations are thus inevitable.

In Output :

  • A timetable. It indicates the stages, the traveled distances, the ascent, and the altitude at the stages
  • The curve of the altitudes according to the traveled distance
  • The curve of the altitudes according to the stages
  • The graph of total ascents for every day, useful to plan reasonable stages and avoid the mountain sickness
    And for every trek, possible optional sheets.

The links towards these spreadsheets are recorded in the tab  » Tableurs – Spreadsheets  » under the « GPS » tab. They are referenced in regard to the corresponding logbooks in the tab  » Treks  »

2°) To send the waypoints on Google Earth:

We want now to do the inverse operation: to take the points from a spreadsheet and send them to GE. Click on http: // http://www.gpsvisualizer.com / map_input? Form=googleearth

Go to the box of datas and modify the first line of  titles as follows:  » name, latitude, longitude  » erasing  » desc « .  to make the three column « GE », « coord N » and « coord E » of « GPS »correspond.

After copying / pasting in a new sheet these three columns from the « GPS » sheet, it is then necessary to add a comma of separation following each name and following each latitude (possibility of making it automatically on Excel with the function « concatener »).

Click on  » create KML file ». It is not necessary to modify the other parameters of the software, the altitude being calculated on the ground, directly by GE.

Now, the three columns are copied and pasted in GPSVisualizer.

transcription Excel à GE comp

We just have to click on the name of the file .mkz created by GPSVisualizer to send the waypoints in GE. It is necessary to locate the way passing by every point. This is rarely a straight segment.

projection des points sur GE


Warning:

The users of this modus operandi are responsible for risks they take by venturing in mountain or somewhere else. The GPS is not enough either to protect from natural risks, and more, from faults of appreciation due to the lack of experience or to guarantee that the paths did not change. The mountain is always right, it is merciless with those who rub themselves without precaution and even sometimes with the others!


Generate a Roadmap Project

situationExample of a project to generate

Foreword:

Our freedom is our most precious good. I am Charlie and will remain Charlie, I’ll never forget the attacks committed against the Freedom in Paris on January 7th, 8th and 9th, 2015

Our most precious good can be divided infinitely without shrinking. That is why this modus operandi is put at the disposal of trekkers, avid to leave for autonomy into the mountain – or somewhere else 🙂

This provision completes the collection of logbooks (Tab Treks), with this hope to get in return your contributions, remarks and improvements as well as your routes which can widen our library.

The users of this modus operandi are responsible for risks they take by venturing into mountain or somewhere else. The GPS is not enough either to protect against natural risks, and even more, from faults of appreciation due to the lack of experience or to guarantee that paths didn’t change. The mountain is always right, merciless with those who engage themselves without precaution and even sometimes with the others!

Objectives:

When we want to create a route in a region for which there are no data to be automatically imported in the GPS (case of Nepal, India), it is necessary to create this route by ourself.

Modus Operandi:

A route is a set of segments taking place by points following each other. Every point defines itself by its name, its GPS coordinates, its altitude and the distance connecting it with the following point. Every point is named and contained in a file.

The routes must be created with a sure support, supplying these four source data: name, both coordinates, altitude and distance between points. The support, here, is Google Earth (GE).

1st stage:  Identify the points by which the route will pass. They are named and placed one by one on the support (GE), in a specific file.

The number of points depends on:

  • the precision we wish to have and
  • the capacity to reveal where the route really goes (forests, non-existent paths, inaccuracies of the satellite photo)

écran point GE EN comp

satellite photo on Google Earth

Second stage: the file must be then exported towards the spreadsheet given at the end of article:

  • Either manually towards the « GPS » sheet. For that purpose, look for every point for coordinates, copy and paste in the corresponding cells of the line attributed to the point, copy then its altitude.
  • Or automatically, with GPSvisualizer. In this case, which is to be favored because it’s much less boring,
    • Record the GE file of the points of the route in a directory of your computer
    • Go then on GPSvizualiser (http: // http://www.gpsvisualizer.com / convert_input). Ask for the extraction of the altitudes ( » add Dem elevation data « ) then convert the file (it is a .mkz) in a » plain text  » file.
    • This  » plain text  » file is then opened and copied ( » select everything  » then ctrl V) to be pasted in a  blank Excel sheet.
    • Locate the four columns corresponding to three source data: the name, the coordinates, the altitude

GPSVisualizer EN comp

GPSvisualizer Input mask


GPSVisualizer2 EN compGPSvisualizer converted datas in text 

GPSVisualizer3 EN comp The file is pasted on a blank excel sheet

  • Having made sure that the number of points is lower than lines in the « GPS » sheet, paste the data column by column in the « GPS » sheet. If GE name is not the same that those of the places, indicate the names of the real places in the column  » nom GE ou nom du lieu si différent de nom GE » (column D). If GE name are identical to the names of places, when they exist, paste names GE in the column  » nom GE ou nom du lieu si différent de nom GE » (column D). In this column, the names of Night Stages will be extracted by the calculation. If there is not enough lines, it is necessary to insert new lines then of refresh* the computation zone ( grey zone at the middle of the screen).
  • Collect the distances between every point and complete the « GPS » sheet. It is often necessary to make a record by looking for the frequent and important bends of the route in mountain. They are not always visible, particularly in forests. Approximations are thus sometimes inevitable. The indication of the slope calculated between points allows in this case to estimate a probable distance.
  • It just remains to determine the Nights Stages by indicating « n » in the cells in intersection between column for « N » and the line of the point for the night stage. This can be repeated by modifying the positions of « n » to obtain compatible stages with the objectives (duration, distances, elevation)
  • The spreadsheet calculates slopes,elevation, total distance at the stages.

feuille GPS vierge EN compThe spreadsheet « GPS » without data

feuille GPS renseignée EN comp

The spreadsheet « GPS » is now filled

*Possible refreshment of a calculation area:

When cells are deleted or added in the data zone (white zone to the left), the values of certain calculation cells (grey zone in the middle) become false in the lines following the addition or the deletion. In this case, select as indicated in photos below, calculation cells of a line above the zone of addition / deletion (column K to T) (1) point the low corner at the right of the selected zone, left click of the mouse ( 2 ), come down to the bottom of the calculation zone by maintaining the left click of the mouse (3) 🙂

rafraichissement1 compThe deletion of a line pulls an error on computation zones

rafraichissement2 comp (1) and (2) Select the calculation zone on a line above and click at the low right corner

rafraichissement3 comp (3) By maintaining the left click of the mouse, come down to the bottom of the calculation zone


On output, we find:

A timetable. It indicates the stages, the daily elevation, the traveled distances and the altitudes at night stages

0001c

Remark: for the presentation, the zones of the schedule not informed by the calculation (trek shorter than 23 days) can be manually completed with information on the journey following the trek.

A curve of the altitudes according to the traveled distance (names of maxima to be manually added)

0001b

A curve of the altitudes at night stages (names of the stages to be manually added)

0001a

A graph of total elevation for every day, useful to plan reasonable stages and avoid the mountain sickness (advice: elevation / day < 500m)

0001d

Remark: The rule of 500m / j max is not respected in this example for days 2, 7 and 10

Spreadsheet: tableur vierge

To the possible users: thank you for bringing your support by commenting and by proposing your improvements and complements